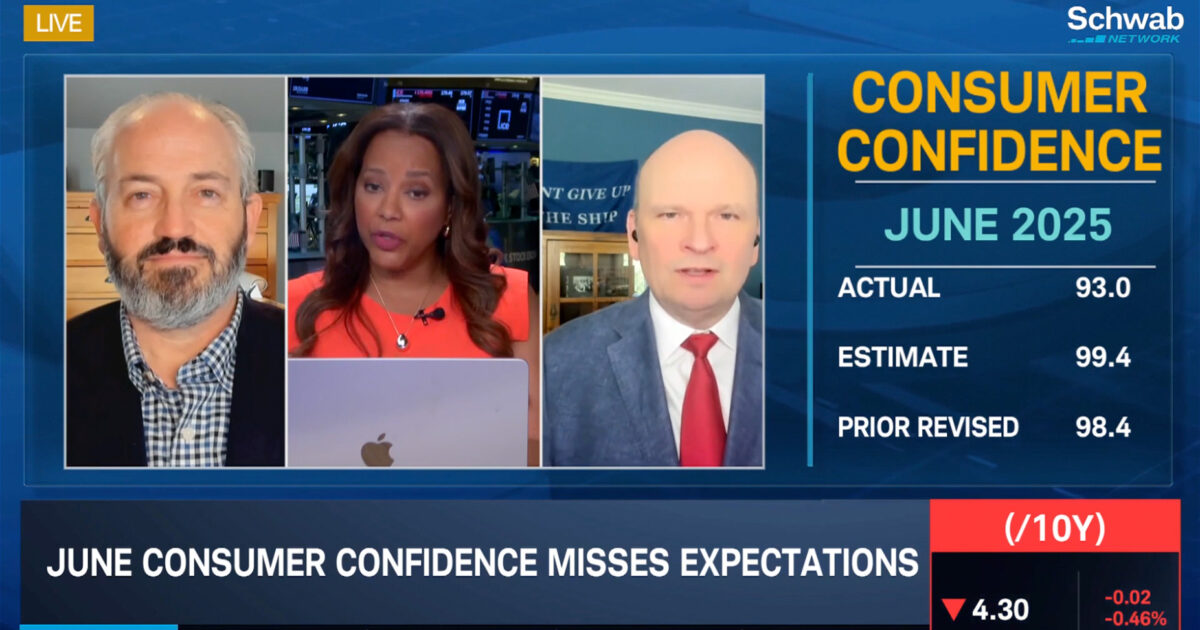
By Arthur B. Laffer, Jr., President

Federal Reserve Chairman Powell popularized the claim that inflation was “transitory” because he believed it was driven by factors that were likely to subside on their own, such as pandemic-related supply-chain bottlenecks, rising energy prices, and a big shift in consumption from services to goods.

Transitory is a great word for politicians and policy makers. They can use it, repeat it and though no one really knows exactly what it means, it becomes part of the lexicon. We would note the word is commonly used to imply a period of short duration and can be applied equally to describe the weather, an upset stomach or continental drift.

So, in a nutshell, transitory implies whatever the source wants it to imply but may mean something very different in reality. What has become more and more clear is that the experts don’t really know for how long inflation will rear its ugly head. But don’t worry, it’s just transitory.

Economists like the former US Treasury Secretary Larry Summers and IMF chief economist Olivier Blanchard have been warning that inflation was not transitory and could get out of hand quickly unless action was taken by central banks and policy makers.

We agreed with this analysis and during March of this year we started to reposition the Laffer Tengler Dynamic US Inflation strategy into the rising inflation environment. Our timing couldn’t have been better, March was the turning point for the rise in inflation as illustrated by both the Consumer Price Index as well as the Producer Price Index (see charts below) both of which are key economic inflation indices.

In the US and many other countries, inflation is now at the highest level it has been for almost four decades. Many inflation hawks fear that as wages continue to respond to inflation, a wage-price spiral could permanently lift the rate of price growth. Time will tell. But we remember the 1970s and it wasn’t pretty.

Inflation By the Numbers – Prices Are Really Heating Up

During the COVID lockdowns the Consumer Price Index (“CPI”), which is a broad measure of average domestic inflation, remained quite muted up until the end of the first quarter of 2021. March generally corresponds to the mass rollout of vaccinations and broad relaxing of pandemic work and travel related restrictions. Since March, CPI has been on a tear with numbers not seen since the 1970’s and culminating with a year-over-year change in November 2021 of 6.8%! Not surprisingly, the spike in consumer prices is also being reflected in producer prices. The Producer Price Index (“PPI”) really started to rise in March (what a coincidence) and has hit a recent high in November of 9.6% year-over-year. The PPI is different from the CPI in that it measures costs from the viewpoint of industries that make the products versus what consumers pay. They are both independently confirming significant inflationary pressure in the US economy.

Price Behavior is Not Homogenous – Sticky and Flexible CPI

Another interesting view of inflation is to look at the price behavior of two different subsets of CPI. In the chart below, we have displayed two seldom followed series of inflation data calculated by the Atlanta Federal Reserve Bank. The orange line displays the part of CPI that is more “flexible” (“US Flexible CPI”) as it relates to how frequently its components historically change in price. An example of a CPI item with flexible price behavior would be the price of tomatoes. The price of tomatoes changes on average every 3-4 weeks. On the other hand, the blue line displays the components of CPI that are more price “sticky” (“US Sticky CPI”) or the ones that change in price far more infrequently. An example of a sticky component of CPI would be laundromat prices. Coin operated laundry prices have historically changed on average every 6.5 years. That’s a big difference!

The sticky index looks fairly stable but the November 2021 year-over-year index hit 3.4%. This level hasn’t been seen since the early 1990’s and warrants watching. You would expect the flexible series to be much more volatile than the sticky series and it is. But even so, the flexible series hit an all-time high in November of 2021 of 17.9% year-over-year! That includes the high inflation 1970’s when the series hit its previous high of 16.7% in March of 1980.

Inflation is Very Personal – The CPI Is A Weighted Average

This is where we get into how the sausage is made or more specifically how CPI is calculated but only in general terms. The chart below is the high-level breakdown of the major categories that make up the CPI and their relative weights as determined by the US Bureau of Labor Statistics. We have rounded the categories to the nearest whole percentage for simplicity purposes so they may not total to 100%. The BLS is scheduled to update the official weights in January 2022.

Looking at the breakdowns of categories in the chart you should note that Housing makes up a very significant part of the calculation for CPI (~44%) Transportation and Food are the next two largest contributors to CPI but each individually make up only a little more than one third of the contribution of Housing. What is also important to note is that the CPI is really an average of not only prices across the nation but also an average of American consumers across the nation. That means the specific inflation pressures that each of us personally experience will most likely be quite different than the actual CPI reading.

How much higher or lower depends in large part on where we live, what we buy and how much we make. For example, somebody who lives in San Francisco may not own a car and as such they experience very little direct impact from the recent big increase in car prices or very high California gasoline prices. On the other hand, that same person lives in one of the most expensive housing markets in the United States. The amount of income they spend on rent, or the imputed rental value of their home, may be significantly more than the average American.

So, what does this all mean? It means that the CPI is very useful as a general gauge of inflationary pressure but that’s it. For all of us inflation is really a very personal experience.

Where Does This Leave Us?

Fed Chairman Powell said that the Fed will back off from using the word “transitory” to describe the fast pace of price increases, as Federal Reserve policymakers acknowledged the increasing risk of more persistent inflation. “We tend to use [transitory] to mean that it won’t leave a permanent mark in the form of higher inflation,” Fed Chairman Jerome Powell told Congress at the end of November. “I think it’s probably a good time to retire that word and try to explain more clearly what we mean.”

The central bank had been using “transitory” since the beginning of the year, when Fed officials warned that nuances in year-over-year comparisons and supply chain bottlenecks would lead to elevated inflation readings.
The message was that those higher readings would fade in the later part of 2021. Instead, inflation accelerated and kept accelerating.

Powell acknowledged that the “risk of higher inflation has increased,” but reiterated that his baseline expectation is for inflation to fall closer to the central bank’s 2% target over the course of 2022.

Time will tell if the Fed is right this time or whether we are in for a bumpy road as Omicron surges around the globe and the prospect of new COVID related supply chain disruptions emerges.

In the meantime, rest assured, we are watching.

Arthur B. Laffer, Jr., President


General Disclosures

Advisory services offered through Laffer Tengler Investments, Inc. Information and commentary provided by Laffer Tengler Investments, Inc. (“Laffer Tengler”) are opinions and should not be construed as facts. The market commentary is for informational purposes only and should not be deemed as a solicitation to invest or increase investments in Laffer Tengler products or the products of Laffer Tengler affiliates. The information contained herein constitutes general information and is not directed to, designed for, or individually tailored to, any particular investor or potential investor. This report is not intended to be a client-specific suitability analysis or recommendation, an offer to participate in any investment, or a recommendation to buy, hold or sell securities. Do not use this report as the sole basis for investment decisions. Do not select an asset class or investment product based on performance alone. Consider all relevant information, including your existing portfolio, investment objectives, risk tolerance, liquidity needs and investment time horizon. There can be no guarantee that any of the described objectives can be achieved. Laffer Tengler Investments, Inc. does not undertake to advise you of any change in its opinions or the information contained in this report. Past performance is not a guarantee of future results. Information provided from third parties was obtained from sources believed to be reliable, but no reservation or warranty is made as to its accuracy or completeness.

Different types of investments involve varying degrees of risk, and there can be no assurance that any specific investment will be profitable. The price of any investment may rise or fall due to changes in the broad markets or changes in a company’s financial condition and may do so unpredictably. Laffer Tengler Investments, Inc. does not make any representation that any strategy will or is likely to achieve returns similar to those shown in any performance results that may be illustrated in this presentation.

There is no assurance that a portfolio will achieve its investment objective.

Definitions and Indices

The S&P 500 Index is a stock market index based on the market capitalization of 500 leading companies publicly traded in the U.S. stock market, as determined by Standard & Poor’s.

Unless otherwise noted, index returns reflect the reinvestment of income dividends and capital gains, if any, but do not reflect fees, brokerage commissions, or other expenses of investing. Investors cannot make direct investments into any index.

Laffer Tengler Investments, Inc. is a Registered Investment Advisor. Registration with the SEC or a state securities authority does not imply a certain level of skill or training. Laffer Tengler’s advisory fee and risks are fully detailed in Part 2 of its Form ADV, available on request.